08111191873
  08111191873


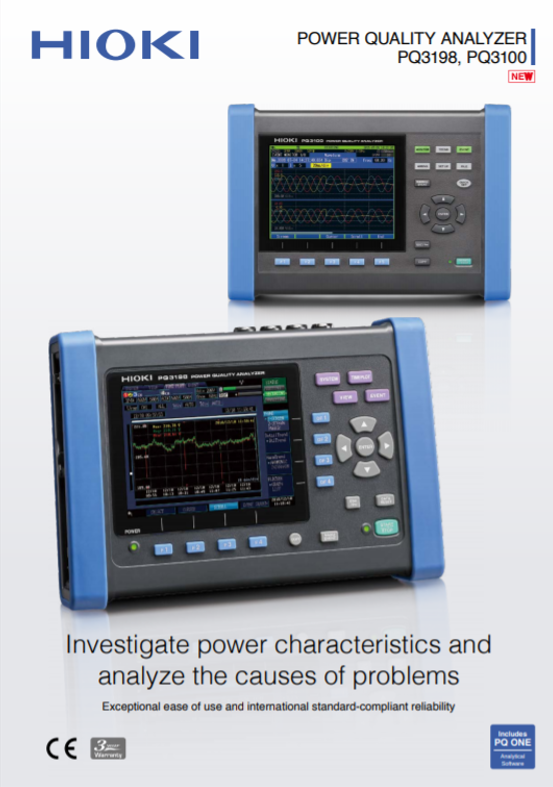
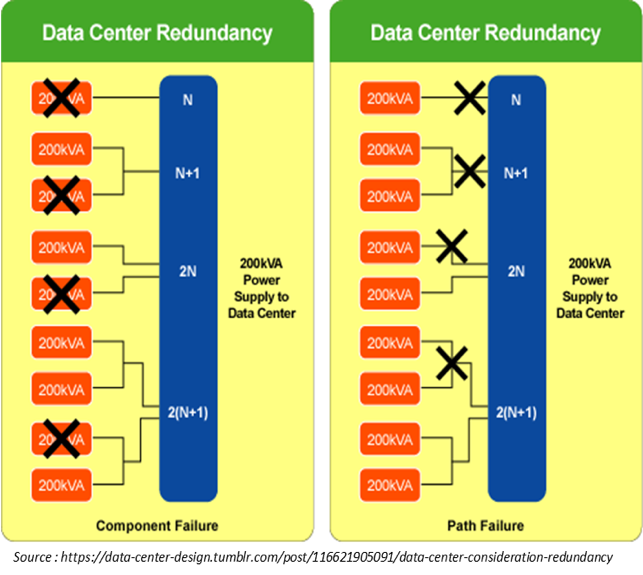
Data center adalah fasilitas fisik yang berisi jaringan komputerisasi dan sumber penyimpanan untuk mengirimkan aplikasi dan data penting tanpa gangguan. Kunci komponen termasuk router, switch, firewall, sistem penyimpanan, server, aplikasi pengiriman . [1] Adanya peran penting dari data center, sistem dirancang melebihi kapasitas minimumnya (atau disebut dengan ‘Data Center Redundansi’) untuk memastikan kelangsungan operasi bahkan jika ada kegagalan sistem.[2] Gambar 1.0 menggambarkan 4 desain redundan untuk sistem UPS yang menyediakan daya 200 kVA ke data center dan beragam mode kegagalan. Desain 2N sepenuhnya redundan dengan dua UPS independen yang dapat mendukung aplikasi IT tanpa gangguan, sekalipun salah satunya gagal.
Data center membutuhkan power supply tanpa gangguan untuk memastikan data support dan aplikasi yang berkelanjutan. Transfer switch berfungsi untuk mengalihkan sumber power supply dari utilitas ke daya darurat selama ada gangguan daya. Terdapat 2 tipe dari transfer switch – Static Transfer Switch (STS) dan Automatic Transfer Switch (ATS). STS lebih disukai daripada ATS pada redundansi data center karena keuntungan yang terdapat di bawah ini (Gambar 2.0).

Pengalihan sumber daya yang cepat dari STS selama gangguan daya dapat mengakibatkan penurunan tegangan atau tegangan transien karena perubahan tiba-tiba pada suplai tegangan jika STS tidak beroperasi sesuai dengan peruntukannya. Kedua peristiwa tersebut terjadi dalam durasi singkat tetapi dapat merusak mesin data center, tergantung pada tingkat keparahan, durasi, besarnya, dan kemampuan peralatan untuk menahan penurunan atau peningkatan tegangan mendadak. Oleh karena itu, pengujian STS sangat penting sebagai bentuk pemeliharaan, terutama di data center yang sepenuhnya redundan.
Gambar 3.0 di bawah ini menunjukkan pengaturan untuk pengujian STS dalam desain 2N data center redundansi. Hioki Power Quality Analyzer PQ3198 mengukur poin-poin berikut secara bersamaan :
Poin A : Jika ada masalah saat beralih dari STS A ke STS B atau sebaliknya, Voltase Dip atau Tegangan Transien akan terdeteksi melalui PQ3198
Poin B : Jika daya hilang atau pulih sebelum STS A, titik pengukuran ini dapat mendeteksinya melalui pengukuran fasa tegangan
Poin C : Jika daya hilang atau pulih sebelum STS B, titik pengukuran ini dapat mendeteksinya melalui pengukuran fasa arus
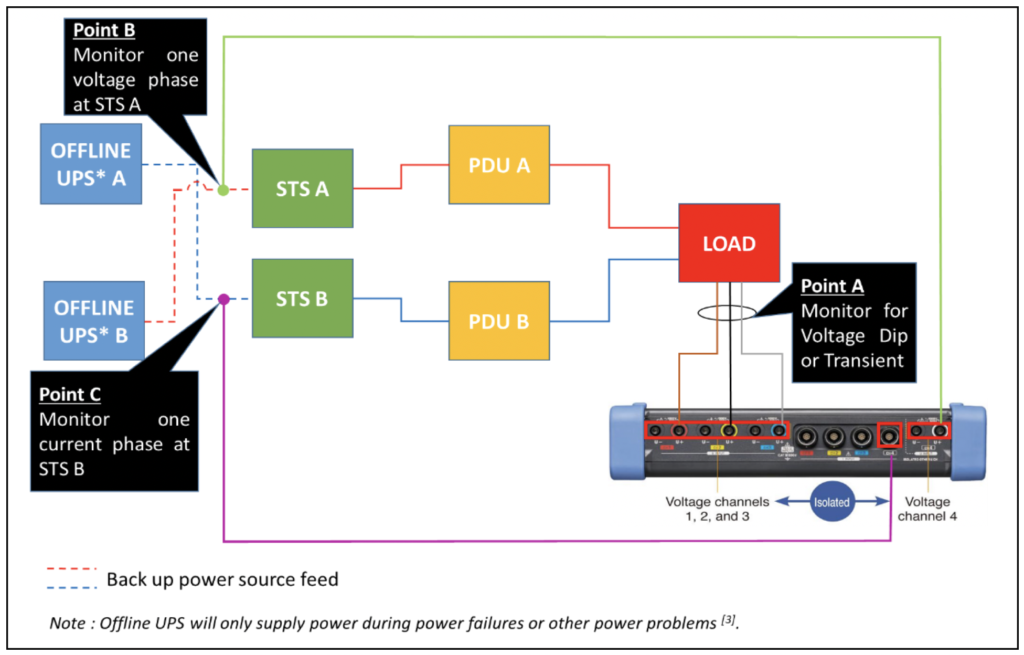
Tiga titik pengukuran memungkinkan korelasi pengalihan STS ke penurunan tegangan atau terjadinya tegangan transien. Gambar 4.0 dan Gambar 5.0 menunjukkan voltase dip dan tegangan transien yang ditangkap selama pengujian STS di data center redundan menggunakan Hioki PQ3198.


Software Hioki PQ ONE memberikan analisis nilai tambah dari voltase dip dengan analisis kurva ITIC. Kurva ITIC berguna dalam menganalisis power quality yang masuk [4 ] – dalam hal ini, tegangan yang masuk ke peralihan daya. STS berisi penyearah untuk mengubah AC (dari UPS) ke DC untuk disimpan di kapasitor bus sebelum dikonversi ke tegangan yang diperlukan. Namun, selama insiden voltase dip atau tegangan transien, tegangan DC dapat menjadi sangat rendah atau sangat tinggi; ini dapat mempengaruhi pengoperasian beban. Gambar 6.0 menunjukkan analisis kurva ITIC menggunakan software Hioki PQ One dengan voltase dip yang diplot untuk setiap fase secara independen.
PQ3198 dilengkapi dengan fungsi HTTP Remote server yang memungkinkan pengguna untuk mengonfigurasi dan memantau instrumen dari browser. Pengambilan data jarak jauh juga mudah dengan fungsi server FTP bawaan.
Fungsi remote hanya dapat melalui router dan local data sim card yang terhubung dengan Hioki PQ3198.
Hioki Memory HiCorders merupakan alternatif lain selain Power Quality Analyzer PQ3198 aplikasi yang tidak berbeda jauh. Selain memiliki kemampuan untuk mengukur voltase dip dan tegangan transien, produk ini juga memiliki beberapa kemampuan lain :
• Multi channels (hingga 32 analog channels)
• High vertical resolution (16 Bit)
• Waktu perekaman yang panjang
• Multi-modular
• Isolated channels
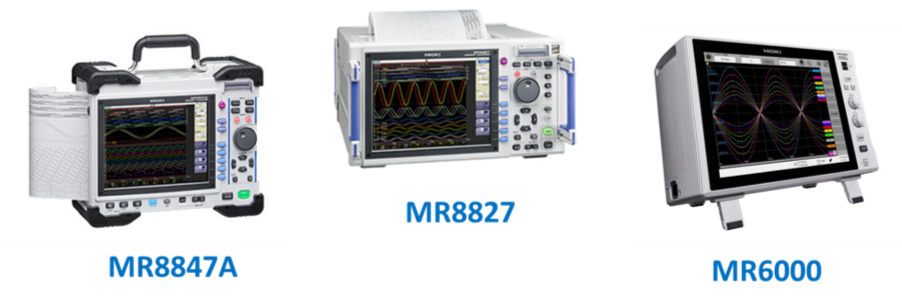
Di bawah ini adalah model Hioki Memory HiCorder yang sesuai dengan aplikasi :
Sistem penuh UPS redundan untuk data center tidak akan dapat beroperasi ke fungsi yang dimaksudkan kecuali Static Transfer Switches (STS) berfungsi sesuai dengan peruntukannya selama gangguan daya. Oleh karena itu, pengujian STS sangat penting untuk memastikan layanan peralatan pusat data tidak terganggu.
Info lebih lanjut terkait Hioki Power Quality Analyzer PQ3198, dapat Anda klik disini : Hioki Power Quality Analyzer PQ3198
Mengukur Frekuensi Operasi RFID Menggunakan Hioki Impedance Analyzer IM758x
Apa itu RFID?
RFID atau singkatan dari Radio-frequency identification dan menggunakan medan elektromagnetik radio untuk mengirimkan informasi digital. Dikarenakan metode pengumpulan informasi dilakukan secara wireless dan tanpa kontak, teknologi ini menjadi sorotan selama pandemi, terutama di industri kesehatan dan pemasokan kebutuhan.
Baca : Hioki Power Quality Analyzer
Terdapat potensi besar dalam teknologi RFID belakangan ini karena dirasa mampu mengurangi kontak fisiik dan dapat menjadi upaya dalam melawan COVID-19.
Beberapa rumah sakit bahkan menggunakan teknologi RFID untuk memantau seberapa sering tenaga kesehatan mereka melakukan rutinitas cuci tangan.
Industri lain/aplikasi lain yang menggunakan teknologi RFID antara lain :
-Pemasok Kebutuhan Harian
-Passport
-Kartu Identitas
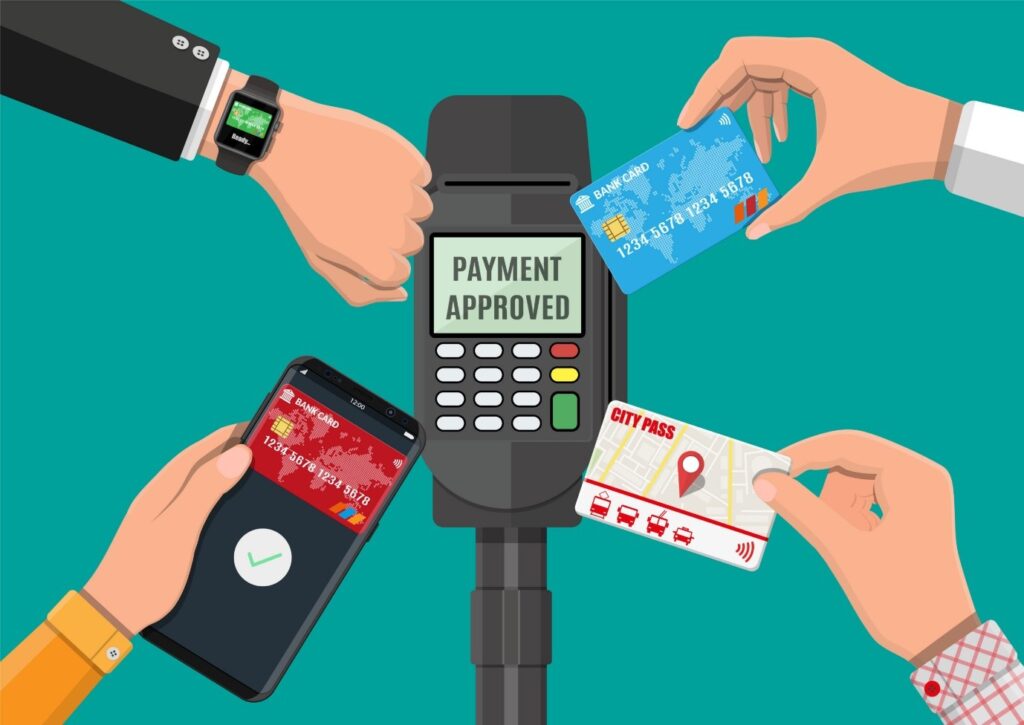
-Pembayaran Non-Tunai
-Industri Makanan
-Industri Kesehatan
-Industri Otomotif dan lainnya..
Frekuensi Operasi RFID :
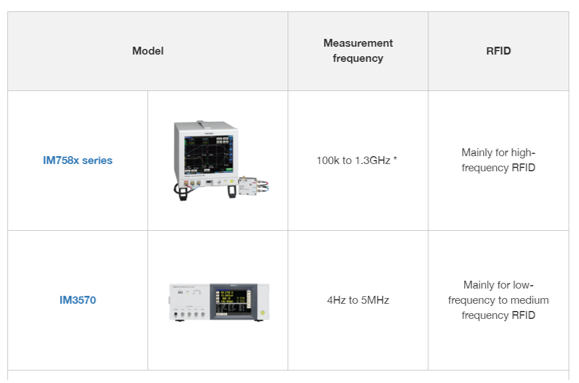
Frekuensi pengoresian RFID, atau dikenal sebagai IC tags maupun contactless IC cards, ditentukan oleh suatu standar. Saat melakukan pengukuran L dari alat yang digunakan oleh IC card tersentuh, pengukuran harus dilakukan di dekat frekuensi operasi 13.56 MHz.
Contoh pengaturan dari kondisi pengukuran
| Mode Pengukuran | ANALYZER |
| Parameters | Z-θ frequency characteristics analysis(L-Q、R evaluation available) |
| Sweep parameter | FREQ |
| Sweep frequency | Sweep measurement close to the operating frequency (lihat tabel di bawah) |
| Signal level | V mode 1V (350x, IM35xx series) atau 1dBm (IM758x series) |
*Pengaturan di atas berlaku untuk contoh pengukuran. Karena kondisi optimal bervariasi dengan target pengukuran, pengaturan khusus harus ditentukan oleh operator instrumen.
Standar RFID
| Kategori | Frekuensi | Jarak Efektif | Standar |
| ID cards | 13.56MHz | Up to 10cm (Proximity applications) | ISO14443 |
| Automatic recognition | 125kHz | Up to 70cm (Vicinity applications) | ISO14443 |
| 13.56MHz | ISO15693 |
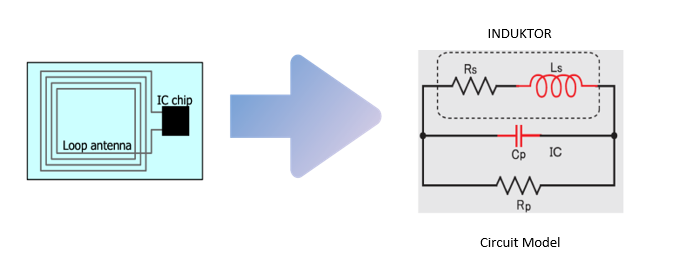
Struktur dari RFID tag
RFID umumnya terdiri dari antena dan IC. Transmisi sinyal dilakukan oleh sirkuit resonansi yang dibentuk oleh induktor antena (Ls) dan kapasitansi input (Cp) internal chip IC.
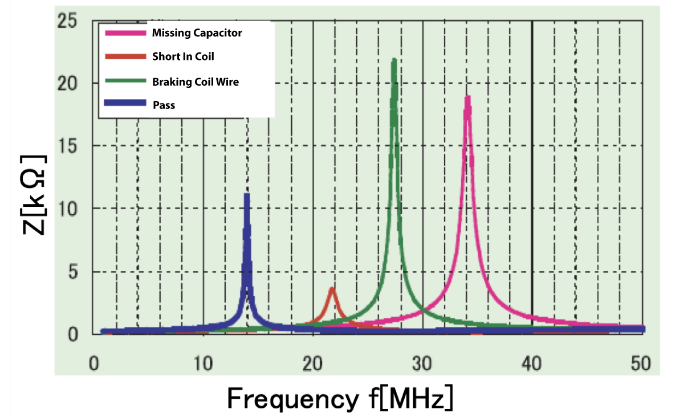
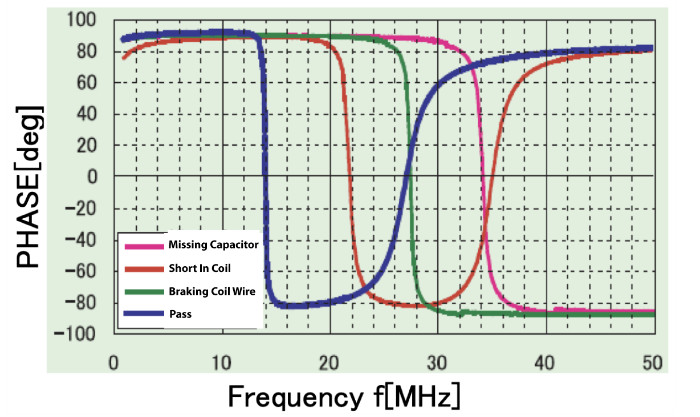
Frequency characteristics of defective and non-defective components
Seperti yang ditampilkan pada gambar, karakteristik frekuensi Z-θ dari komponen yang rusak dan tidak jelas berbeda. Komponen tidak rusak menunjukkan titik resonansi di dekat frekuensi operasi.
Produk yang digunakan
Aplikasi pada Production line dan R&D
Penilaian Pass/Fail Menggunakan Mode Analyzer
Salah satu dari dua metode dapat digunakan untuk menghasilkan penilaian pass/fail ketika menggunakan mode analyzer: penilaian puncak (peak) dan penilaian area.
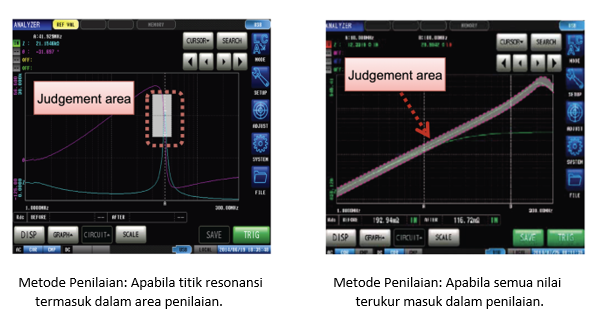
Peak Judgement Area judgement
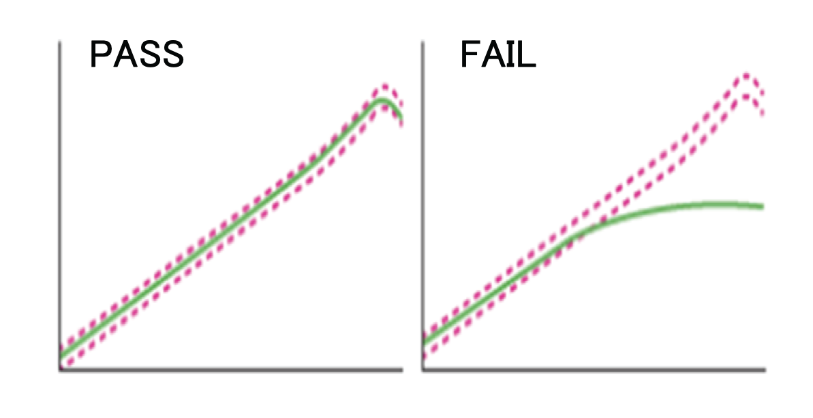
Penilaian Area (Area Judgement) dapat diatur seperti di bawah ini
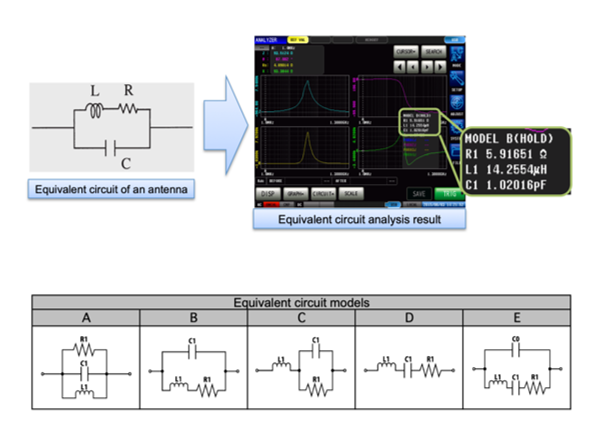
Memastikan Konstanta Listrik Dengan Cara Analisis Rangkaian Ekuivalen
Fungsi analisis sirkuit ekuivalen instrumen dapat digunakan untuk menghitung konstanta dalam model sirkuit tiga terminal seperti antena RFID.
* Model A harus digunakan untuk kumparan dengan core loss (R) yang besar untuk memfasilitasi analisis yang lebih akurat.
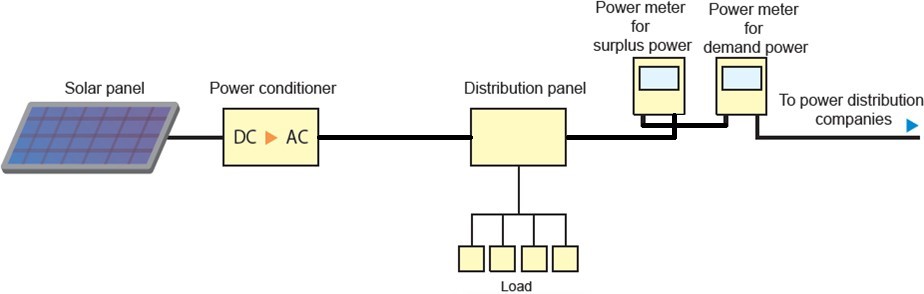
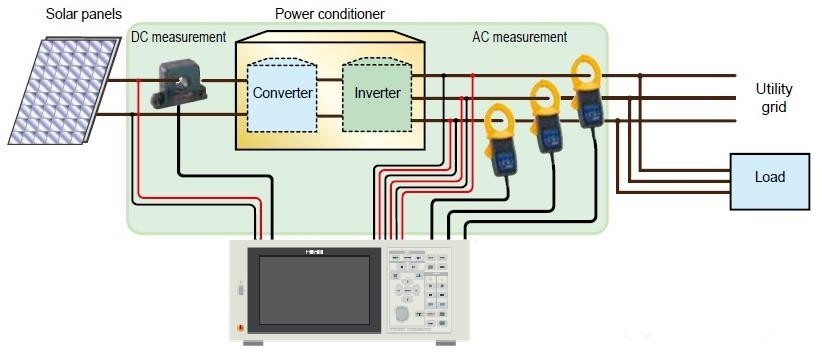
Solar power generating systems are using Photovoltaic (PV) technology to absorb sunlight and convert it into electricity that we can use. The array of a photovoltaic power system, or PV system, produces direct current (DC) power which fluctuates with the sunlight’s intensity. For practical use this usually requires conversion to certain desired voltages or alternating current (AC), through the use of inverters. Some systems require a battery bank to store the solar electricity for use during night time or cloudy weather, a charge controller to protect the battery bank from overcharge.
Baca : Hioki Power Quality Analyzer
We can basically see that solar power generation is a complex system with many electrical parts involved so that we need to measure, monitor, analysis and record the measured data to maintain the system as well as to resolve the problems on a daily basis.
Electrical testing
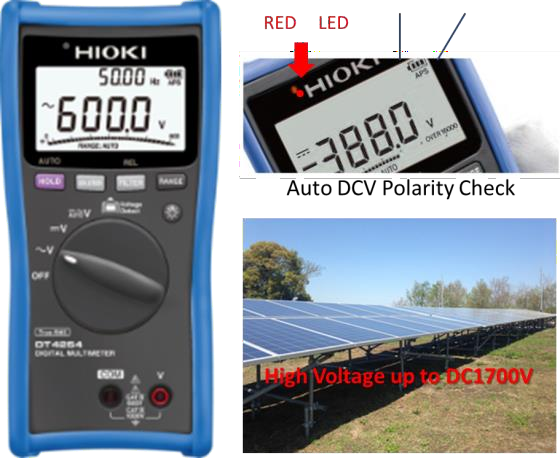
Digital multimeters (DMMs) and clamp meters are easy to use with standard voltage and current measurement for maintaining solar power systems.
Hioki DT4254 is dedicated for voltage measurement with high voltage up to DC1700V that is useful for PV system where the DC voltage is normally over 1000VDC.
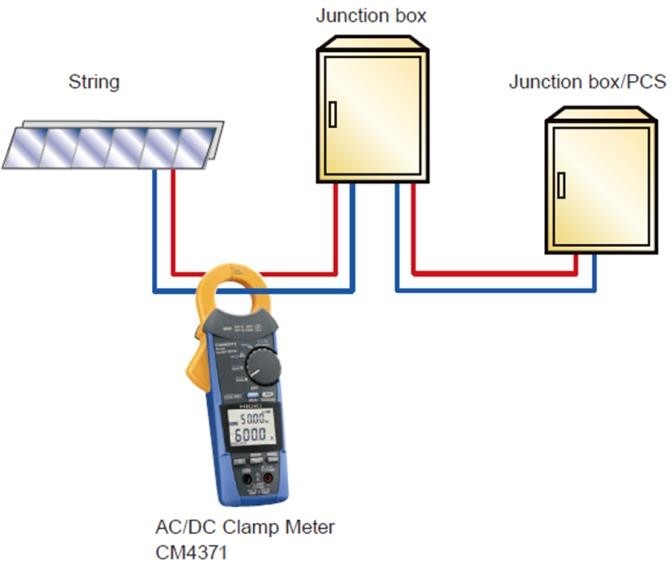
At the junction box, use a Hioki CM4370 series AC/DC clamp meter to measure the current of each string generating power that’s being sold back to the grid. The string with the anomaly will have a noticeably lower current. Compare readings for strings in the same junction box and look any discrepancy to identify which string is being affected by the anomaly.
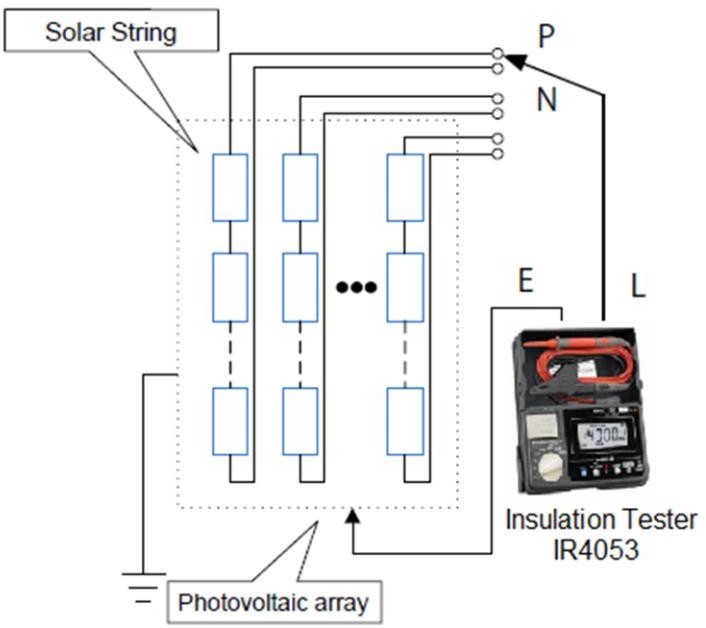
Insulation resistance measurement of solar panels
When measuring the insulation resistance of a solar panel that is generating electricity, remember not to apply the standard method for measuring the circuit’s insulation resistance and bear in mind that the photovoltaic cell voltage affects the test voltage and that there is the risk of damaging other equipment if the array is grounded.
The Hioki IR4053 Insulation Tester can accurately measure insulation resistance without being affected by generating PV.
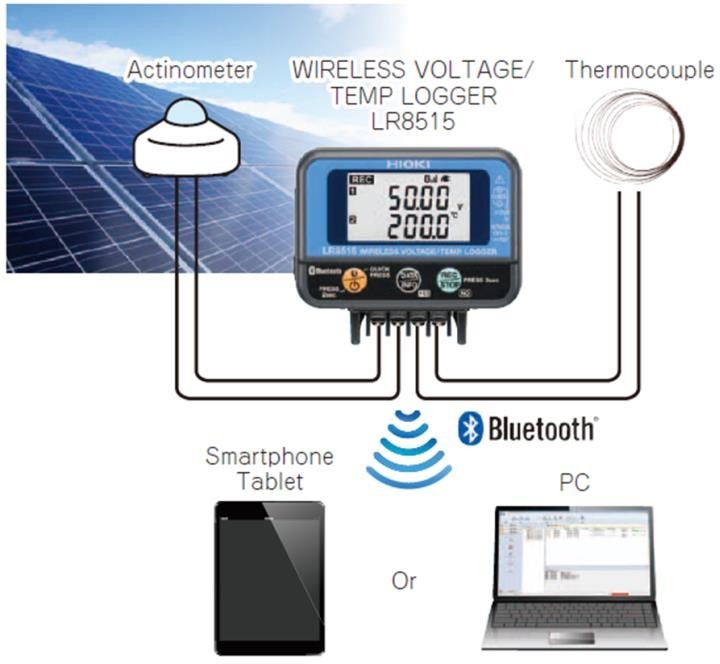
Measure insolation and temperature wirelessly
Hioki LR8515 mini data logger can be used as a method for wirelessly capturing actinometer and temperature data at the desired timing measurement.
Manage the voltage of lead-acid storage batteries
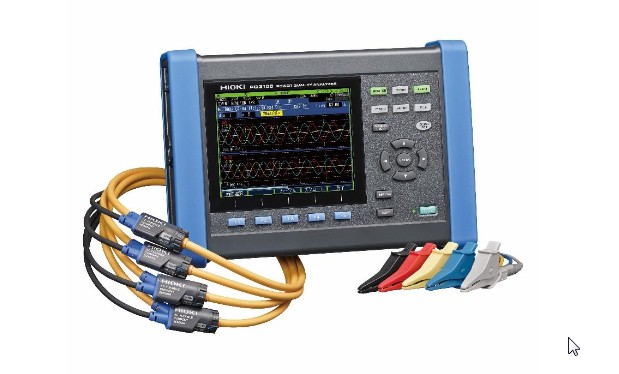
The HIOKI LR8400-20 series with 30 channels as standard, expandable to 60 channels can be used to measure the voltage of lead-acid UPS battery cells used for solar power supply for monitoring voltage fluctuations.
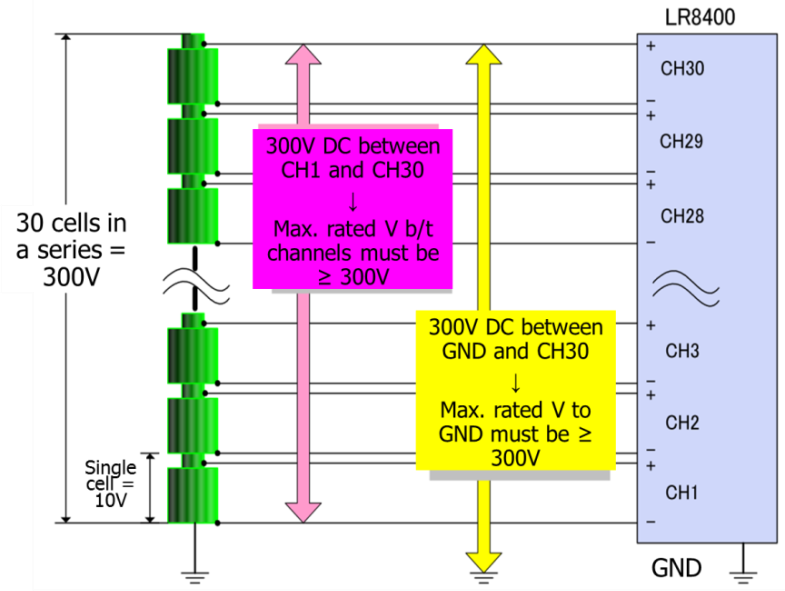
Figure 6: LR8400 data logger in an online UPS monitoring system
Checking the amount of electricity sold and the power quality of solar power generation systems
The new Hioki PQ3100 Power Quality Analyzer can measure the amount of electricity sold and purchased simultaneously. The data allows you to confirm that the PV system works normally.
The PQ3100 can measure output of the power conditioner and display voltage and frequency changes. Demand and change graphs displayed in colour on the screen of the PQ3100 allow you to check the operation of the PV system on the spot.
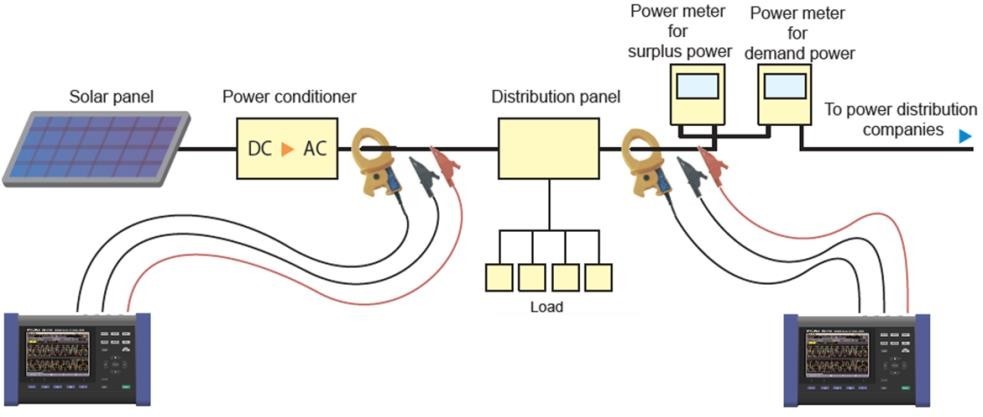
The PQ3100 is also used to measure all power quality parameters such as voltage/current RMS, voltage dip/swell, interruption, transient overvoltage, inrush current, power, frequency, voltage/current unbalance factor, harmonics simultaneously.
Evaluation of input and output characteristics of power conditioners
The PW6001 Power Analyzer can simultaneously measure and display multiple items including DC/AC voltage/current, voltage ripple factor, power, amount of power energy, power factor, voltage/current distortion factors, frequency, amount of power energy sold and purchased, voltage imbalance rate, and efficiency. It also displays voltage/current waveforms.
Multi-string PV inverter efficiency measurement
PW6001 also can be used to measure the efficiency of multiple strings (arrays) and 50/60Hz output to the grid.

As today’s information-centric society continues to evolve, smartphones and other mobile devices are operating at frequencies as high as several gigahertz in order to provide capabilities such as LTE, Wi-Fi, and GPS support. This trend in turn is driving up the frequencies of electronic components such as high-frequency inductors and ferrite beads that are used in those devices. The need to perform characteristics evaluations of these electronic components at high frequencies ranging from several hundred megahertz to several gigahertz is fueling demand for high-frequency measuring instruments.
Baca : Hioki Power Quality Analyzer
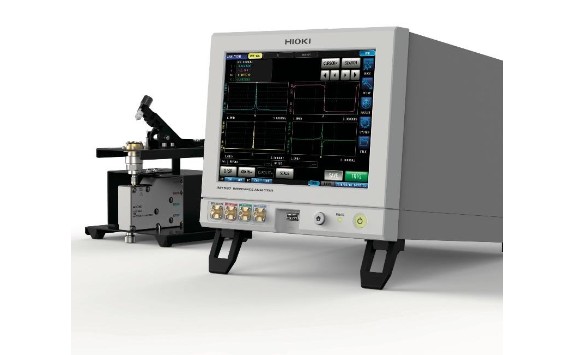
The newly available IM7587 can make measurements at even higher frequencies than the IM7585, which was launched last year (maximum measurement frequency is 1.3 GHz).The IM7587’s measurement frequency ranges from 1 MHz to 3 GHz, enabling it to measure today’s increasingly high-frequency electronic components.
Product Features
1. High-frequency measurement at up to 3 GHz
With a testing frequency of 1MHz to 3GHz, the Impedance Analyzer IM7587 can be used in a variety of applications.In particular, the instrument’s Analyzer Mode, which varies the frequency while making measurements, delivers minimal variability across a wide frequency range so as to ensure highly stable impedance evaluations, enabling it to meet applications in various fields from R&D to manufacturing.
2. Higher productivity thanks to high-stability, high-speed measurement in as little as 0.5 ms
The IM7587 can perform high-speed measurement in as little as 0.5 ms. For manufacturers of electronic components, who must test large quantities of components at high speeds, this capability translates into dramatically increased productivity.
Baca : Impedance analyzer
3. Lower production costs thanks to a more compact footprint
The IM7587 features a compact footprint. This enables electronic component manufacturers who build rack-mounted testing systems for automatic testing on production lines to construct smaller testing systems that pack more instruments into available rack space. The result is shorter testing 2times and lower production costs.In addition, the IM7587 represents the lightest and most portable measuring instrument in its class, taking up minimal workspace and making it ideal across a wide variety of applications including R&D, quality assurance and manufacturing.
4. Extensive functionality for generating pass/fail judgments
In LCR meter mode, in which the instrument makes measurements at a single frequency, the IM7587 offers a comparator function for generating pass/fail judgments for electronic components as well as a binning function for sorting components. The comparator function generates pass/fail judgments using upper and lower limit values set by the user as criteria. Whereas the comparator function generates judgments based on a single set of criteria, the binning function ranks components basing on up to 10 sets of criteria.
In analyzer mode, in which the instrument makes measurements at multiple frequencies, the IM7587 offers area judgment and peak judgment functionality for generating pass/fail judgments based on the frequency characteristics of the electronic component under test. Area judgment is used to check whether measured values for target components fall within a user-defined judgment area, while peak judgment provides functionality for judging resonance points.
The instrument also offers a new capability in its spot judgment function, which generates pass/fail judgments based on multiple user-configured frequency settings.
5. Long-awaited Hioki fixture set
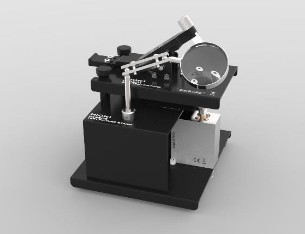
This July, Hiokialso launched the SMD Fixture IM9201, which is indispensable for research and development as well as quality control.The IM9201 can test increasingly high frequency electronic components up to 3GHz, which when paired with the IM7587, brings real power to the field of component testing.
Basic Specifications
* Basic Accuracy: Z: 0.65% rdg.; q: 0.38 (representative value)
* Measurement time: Min. 0.5 ms (analog measurement)
* Measurement range: 100 mΩ to 5 kΩ
* Measurement frequency: 1 MHz to 3 GHz
* Measurement signal level: -40.0 dBm to +1.0 dBm (4 mV to 502 mV)
Principal Applications
* Shipping inspections and characteristics evaluations of electronic components
* Acceptance inspections and characteristics evaluations of electronic components
* Characteristics evaluations of electronic components at universities and research institutions
Currently, engineers use power quality analyzers to monitor and analyze power quality as they investigate the causes of electronic device malfunctions and failures triggered by power quality issues. Hioki’s newly launched PQ3100 introduces DC measurement support in response to increasingly widespread use of renewable energy. In addition, the new instrument meets customers’ measurement needs with features such as its Quick Set function, which guides users through the process of connecting and configuring theinstrument easily and reliably.
Baca : Hioki Efisiensi Energi
Why Power Quality Measurement?
As power electronics devices become more common and varied, the number of electronic device malfunctions and failures that can be traced back to power supply issues is rising. Detailed knowledge of the factors that cause such issues is necessary in order to combat them effectively, but such assessment is an extremely time-consuming task due to the large number of parameters that must be investigated and the advanced level of expertise required in order to do so. By using a power quality analyzer, technicians can accurately and efficiently identify the causes of these issues.
Baca : Hioki Power Quality Analyzer
Against this backdrop, renewable energy sources such as solar power and wind power have been entering into increasingly widespread use. Efforts are also underway to put build what is known as the “smart grid,” and the need to more stringently monitor increasingly complex power transmission systems is rising. Furthermore, improvements in the power environment in developing nations such as China, India, and the countries of Southeast Asia remain inadequate due to the inability of infrastructure development to keep pace with economic growth. Consequently, power issues are an everyday occurrence.
As a result of these and related factors, the need to monitor power quality is growing.
FEATURES OF THE PQ31001.
Tags: hioki, power quality analyzer
PT. HIOKI ELECTRIC INSTRUMENT
Gedung Graha MIR 1st Floor, Zone C
Jl. Pemuda No. 9, Rawamangun, Pulogadung,
Jakarta Timur 13220
Indonesia
Tel. : +6221 29569853
Fax.: +6221 29368940